$x
[1] 1 2 3 4 5

$y
[1] "a" "b"class 3: R basics
2024-01-18
Recap
class 2: Made our own histograms by binning data, understand mean, median and comparing 2 distributions
class 1: installed R, Rstudio and
tidyversepackageIf you already had these installed, check that they are the latest versions or re-install
- R :
version= 4.3.2 ; Rstudio (2022 or 2023 versions) ; tidyverse (just update it if you haven’t installed last week withinstall.packages('tidyverse')
- R :
Today’s class
Refresh: directory structure,
.Rproject,RscriptIntroduce R datatypes: {tip: check datatype with
class()}Simple:
numeric,character. Other simple:factor,logicalCompound: combination of simple datatypes: vector =
c(x, y),list(x, y),data.frame(); [won’t cover:matrix(),array()]Good practices: Commenting code for documentation.
# this code does x (if I get it to work)
Subset compound datatypes
Control statements: decision making:
if()and repeat steps in a loop:for()
Key reference : base R cheatsheet.PDF
Complex plotting assignment
If you are well versed with R basics and are looking for some challenge, this slide is for you
Download the code we used to generate the data for the class2 activity
plot the individual data points from this code
Highlight the 30 points that your team got within this plot
- With a different colour / outline / shape / anything fancy
This will take you ~2 lectures to finish so keep working on it
If you got any questions, you can ask me when I come around ; or the TAs if they are free from helping others learn R basics
Refresh / Rstudio overview
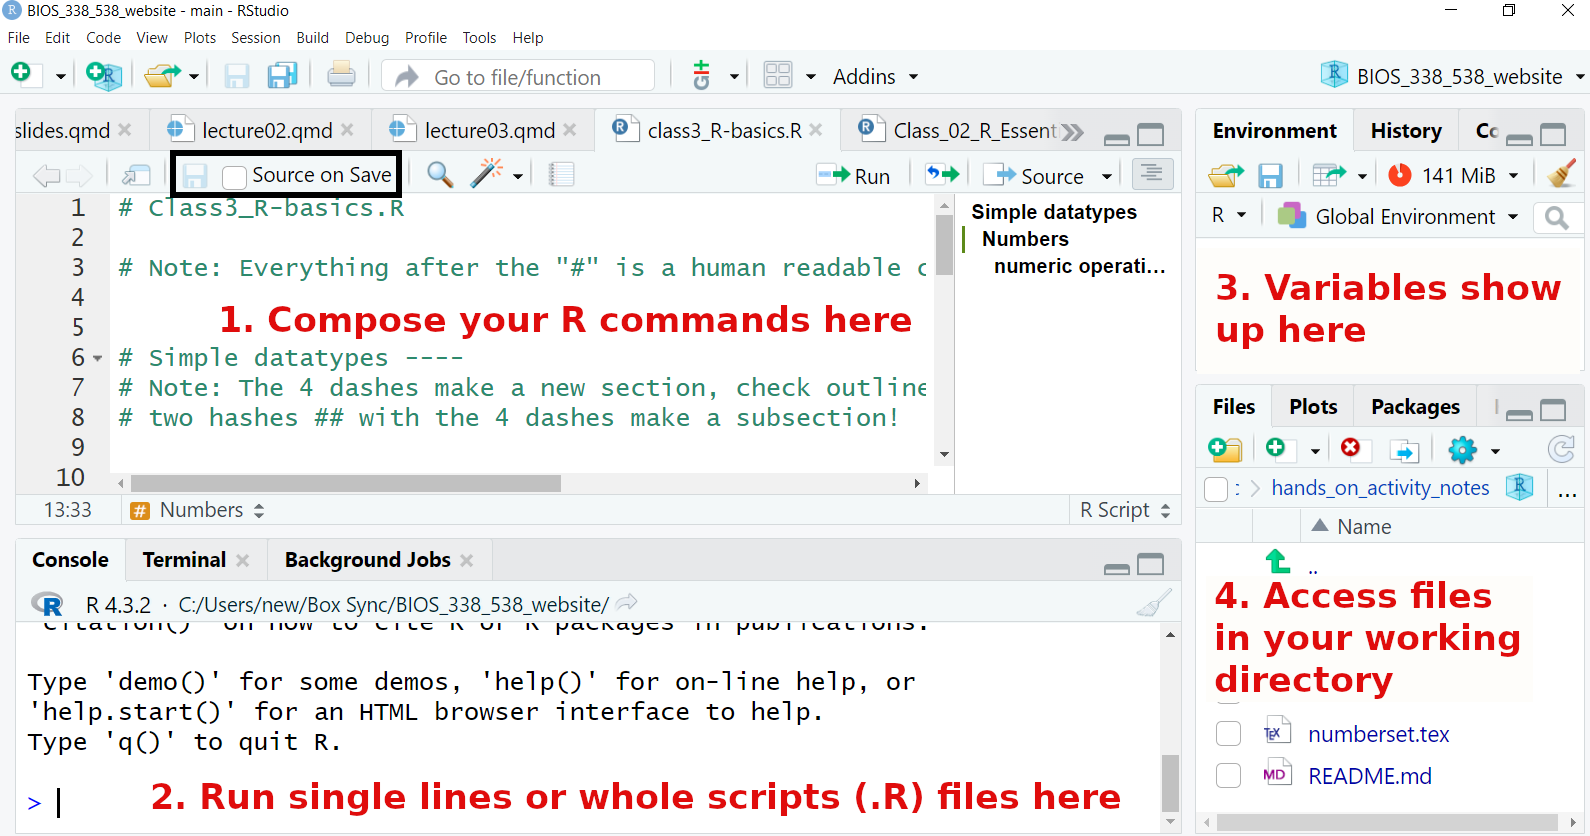
Refresh/setting up
.Rproject file: works from the current directory, saves history of R commands, and all scripts that were open last time..Rscript: A place where you save lines of R code and can run them all from top to bottom with one click or a command :source('..R')
Refresh / setting up
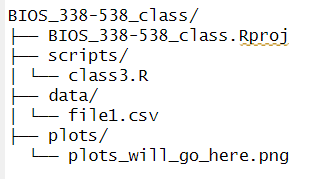
- directory structure:
Directory structure
bash/terminal commands
mkdir: make directorycd: change directoryls: list files and directoriestouch x.txt: make a empty files with any extension, ex:x.txt
Overview of all programming
Take simple datatypes:
1;"apple",TRUECombine into complex data types:
c(1, 3, 5, 7)/c('apples', 'oranges');list( numbers, fruits..)Make decisions:
if(x > 3) "apples are too sweet"Repeat actions with only slight changes:
for(i in 1:5) do something with each iMake concise code by reusing parts as functions:
do_magic <- function(x) {"x + magic here"}
Practice alongside me
Use the script: class3_R-basics.R from Canvas/files/ to follow along
Simple datatypes
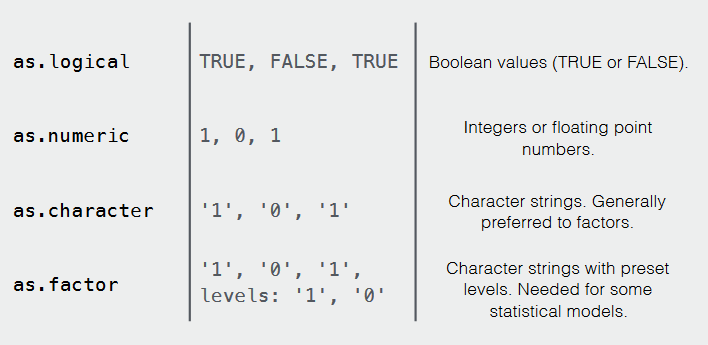
Missing elements marked as NA or NaN

Making these datatypes in R ; assigning to a variable
numeric:
x <- 35character:
y <- 'apples'logical:
a <- TRUE;b <- F;c <- Tfactor:
Compound datatypes
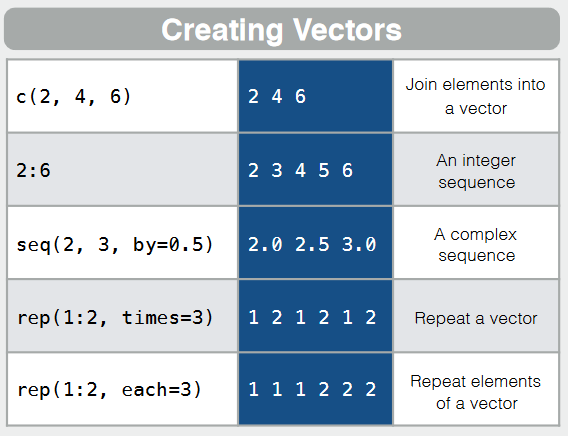
combination of simple datatypes: vector = c(x, y), list(x, y), data.frame(x1 = x, x2 = y)
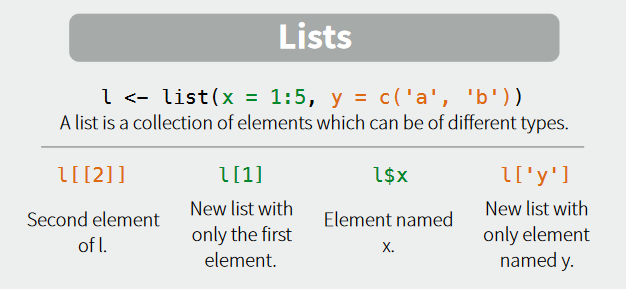
When printed, the list looks like this
A vector where entries are ordered and stored as “levels”
Use cases
Order of colours assigned when plotting stuff
Analyzing categorical questionnaires
Named vector:
c('a' = 1, 'b' = 2)List:
list(x = 1:5, y = c('a', 'b'))
Recap: Lecture 3
Refresh: directory structure,
.Rproject,Rscript, directory structureIntroduce R datatypes: {tip: check datatype with
class()}Simple:
numeric,character. Other simple:factor,logicalCompound: combination of simple datatypes: vector =
c(x, y),list(x, y),data.frame()Good practices: Commenting code for documentation.
# this code does x (if I get it to work)
Subset/indexing compound datatypes:
x[3],x[x>0],dataframe[1,5]Control statements: decision making:
if()and repeat steps in a loop:for()or vectorize using functions
R basics continued
first 20 minutes of lecture 4 ; Date: 23/1/24
Let us quickly finish talking about
Vector subsetting / indexing
Programing :
if..else;forandfunction()
Note: Download the class3_R-basics.R file again from the website (I updated it.. You can rename last weeks file with the _old suffix … _old.R)
Subset compound datatypes
vectors: single element:
x[3], multiple elements:x[x>0], by namex['a']?Lists and dataframes:
whole row/column
list$x1ordataframe$x1ordataframe[ , 2]Single entry:
dataframe[1,5]
Programming = control which statements are executed
- Control statements: decision making:
if()and repeat steps in a loop:for()
if..else :
for() loops